


What are some of the challenges that we face?
[1] The data are large and sparse.
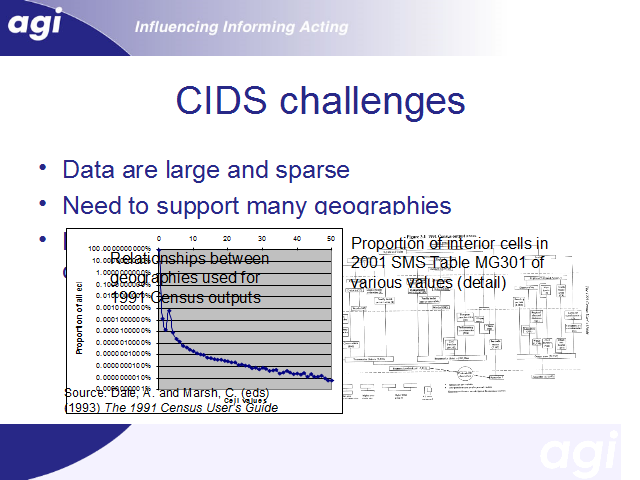
The graph shows the frequency distribution of interior cells (that is, not totals or subtotals) in the most spatially detailed migration data set. The set is comprised of a matrix of flows or potential flows between all pairs of Output Areas in the UK. With 223k OAs, there are almost 50 billion possible origin-destination pairs, and 300billion interior cells.
With only 6million or so migrants to fit in to this matrix, it is pretty sparse! 99.999% of cells are 0, and most of the remaining ones have the value 3.
This is due to the disclosure control methods applied to Census outputs in England, Wales and Northern Ireland, in which all values of 1 or 2 were randomly adjusted such that they became 0 or 3.
Storing sparse data is not a great problem; however helping users find the data that they want, and helping them to extract meaningful results does become a problem with data this sparse.
[2] A second challenge, which arises throughout Census analysis, relates to the complicated geography of the Census. The image is taken from the 1991 Census users handbook, and shows the range of geographies used in the 1991 Census output, and the way in which they are connected. You don’t need to be able to read the detail to grasp the complicated nature of the beast.
We provide access to data from the 1981, 1991 and 2001 Censuses, and aim to make all data sets available for as many geographies as possible. This flexibility gives potential for confusion on the part of the data users.
[3] The overall challenge, given issues such as sparse data and complicated geographies, is to try and provide a simple interface to complex data sets. We aim to hide the complexity from the user without removing flexibility.