


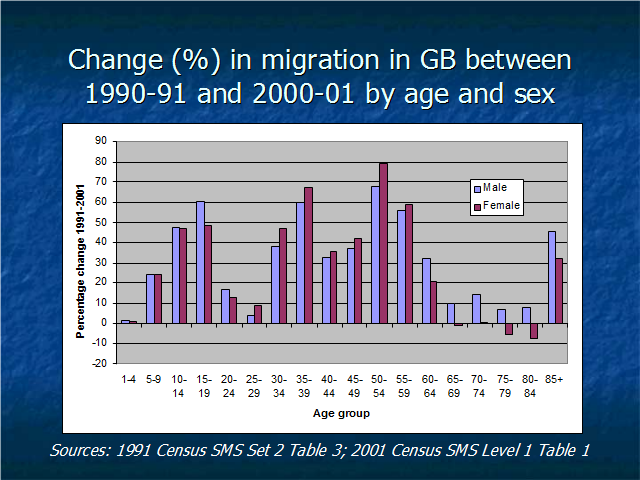
Comparison of the age-sex structure of total migration in the two 12-month periods indicates major increases in 35-39 , 50-54 and 55-59 age groups for both sexes.
There are increases also in the 16-19 age group, although these may well be explained by the inclusion of students.
In older ages, differences are smaller, and decreases occur in migration of females in their late 70s and early 80s.