


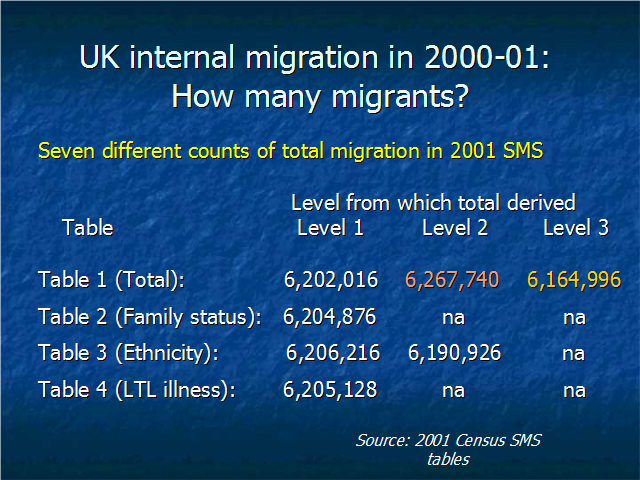
This table contains a summary of the scale and table differences for total migrants and indicates significant differences between total counts from different tables at the same scale and, in particular between total counts from different tables at different scales.
There is no obvious pattern: total from Table 1 at level 2 is higher than total from Table 1 at level 1 but total from Table 3 at level 2 lower than total from Table 1 at Level 1.
It is surprising to find that the difference between ward and district level for Table 1 (64,000) is greater than between OA and district level (37,000).
It seems ironic that we have 7 different counts of total migrants in the UK in the 2000-01 period from a census that is the first so-called ‘One Number Census’!