


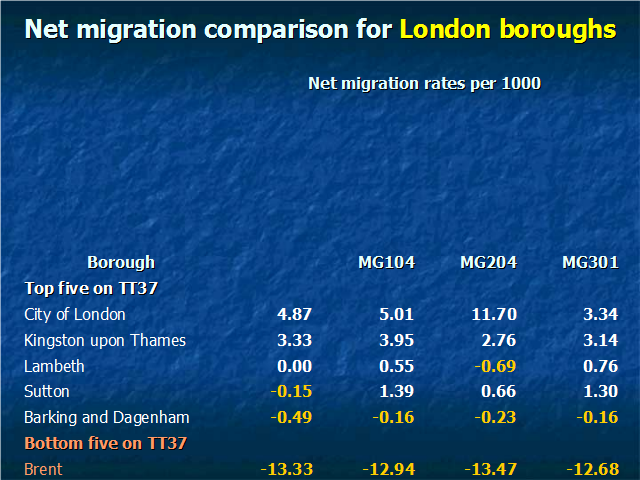
Across most of Greater London, boroughs experience significant losses in terms of net internal migration rates. The table presents the five boroughs of London that are at each end of the net migration league table.
Comparison by eye of the figures presented gives an indication of the variation in rates that occurs. The most significant variation is apparent for the City of London but this is likely to be an anomaly created because of the small population size of this borough and the fact that it may have a higher proportion of small flows subject to SCAM.