


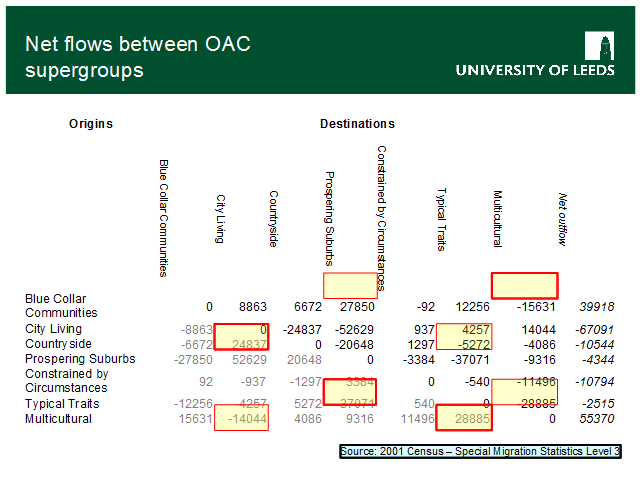
Same data, expressed as net flows. Thus, these are 0 within an area type; and the top and bottom triangles are inversion of each other.
Largest flow (by absolute number) is Prospering suburbs -> City Living
Where do people from City Living go? Largest flow is to Multicultural (ref back to London borough profiles)
Where do people from Multicuultural go? to Typical traits.
From typical traits, largest outflow is to Prospering suburbs.
Would the picture look the same if we dis-aggegated by age?
Should we generate rates?