


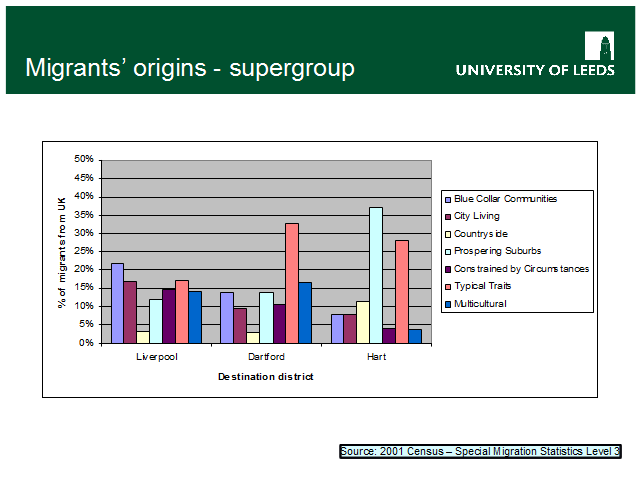
Graphical representation of data on previous page. Unsurprisingly, ‘typical traits’ is large for all areas, but the profiles are different. Do all deprived districts have profiles like Liverpool? Do all non-deprived districts have profiles like Hart?