


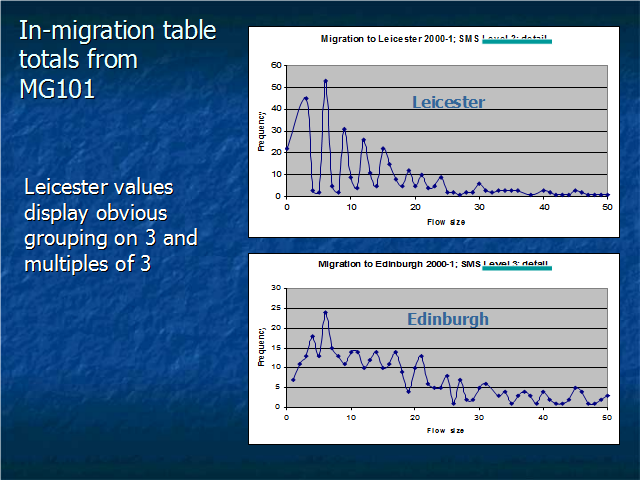
These graphs show the frequency distributions of total in-migration flows from other districts to Leicester, Edinburgh and Aberdeen from MG101.
The Leicester values display obvious groupings on values of 3 and multiples of 3, suggesting that the effect of SCAM is pronounced
The frequency distribution of total in-migration flows to Edinburgh and Aberdeen are rather different. In the case of Edinburgh, there are fewer small flows and more larger flows, whereas in the case of Aberdeen, there is a steady reduction in flow frequencies as size of flow increases.
Why are Edinburgh and Aberdeen so different? There is likely to be a scale effect here. Edinburgh attracts larger flows. But difficult to say which city Leicester is more like in terms of in-migration because of the effects of SCAM.
Producing similar graphs at ward level (i.e. all wards in UK to all wards in Leicester, excluding flows within Leicester) generates results closer to expectation - Leicester exhibits clustering on multiples of 3, whilst for both Edinburgh and Aberdeen the highest frequency flow is '1' followed by a steady decay.