


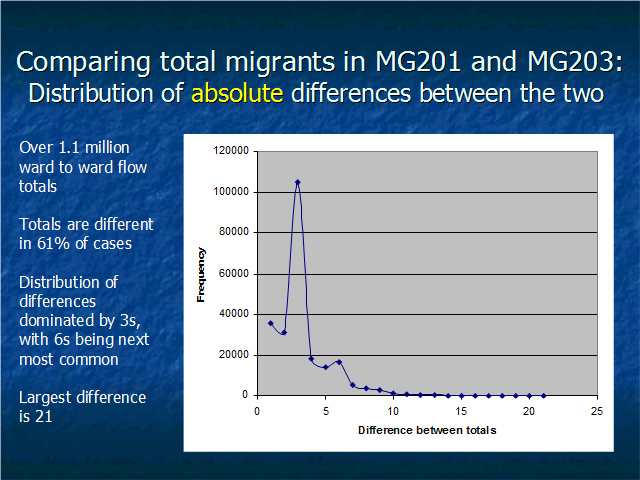
There are over 1.1 million ward to ward flow totals that are non-zero in either MG210 or MG203 or both.
The totals are different in 61% of those 1.1 million cases
The graph shows differences (not totals) between the two tables: consequently it is possible to have differences of 1 and 2
The distribution of differences is dominated by 3s (due to predominance of values of 0 in one table and 3 in another rather than, say, difference between 9 and 12)
The largest difference between the totals is 21 and the frequency of differences greater than 10 is very low