Click here to start
Table of contents
Slide 1
Acknowledgements
Outline
Aims
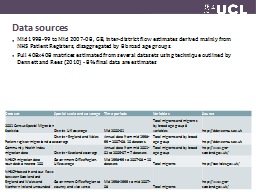
Data sources
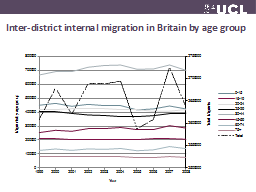
Inter-district internal migration in Britain by age group
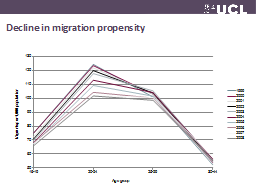
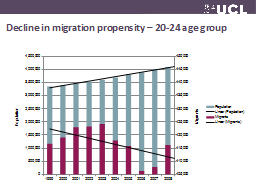
Decline in migration propensity
Decline in migration propensity – 20-24 age group
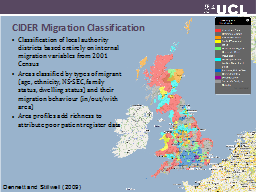
Understanding sub-national patterns
CIDER Migration Classification
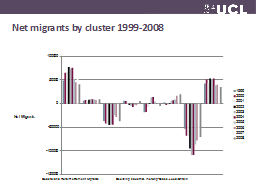
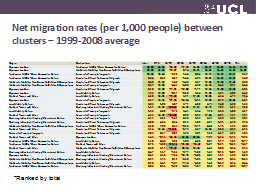
Net migrants by cluster 1999-2008
Slide 12
Slide 13
Slide 14
Slide 15
Slide 16
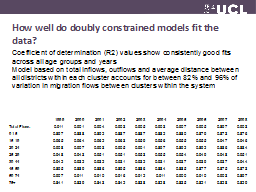
How well do doubly constrained models fit the data?
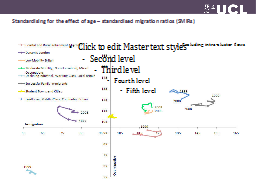
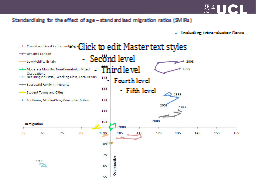
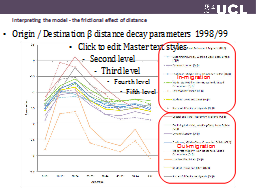
Interpreting the model - the frictional effect of distance
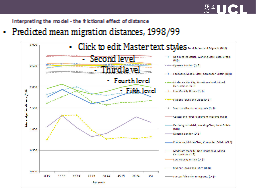
Interpreting the model - the frictional effect of distance
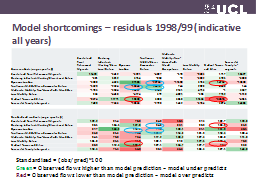
Model shortcomings – residuals 1998/99 (indicative all years)
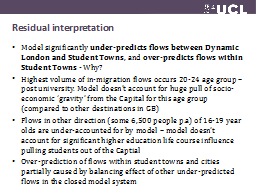
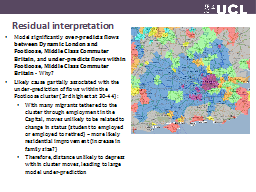
Residual interpretation
Residual interpretation
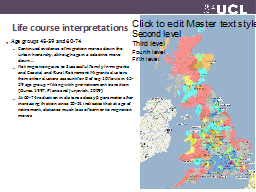
Additional life course interpretations
Additional life course interpretations
Life course interpretations
Life course interpretations
Conclusions
Conclusions
References
Slide 30